Plot a point in lcd
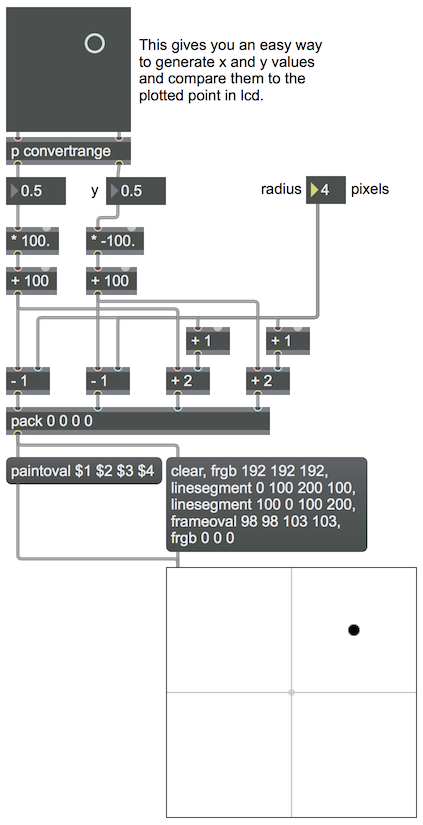
The lcd object is very handy for drawing simple 2D graphics. This patch shows how you can plot a point in an x,y coordinate graph using lcd. The goal is to be able to plot any x,y coordinate pair for which the numbers lie between -1 and 1.
The lcd object in this graph has been sized to be 201x201 pixels, so that it has 100 pixels in each cardinal direction from its center point. We did that just to make the math easy. We’ll consider the center point to be the coordinate 0,0. The pictslider object at the top left is there just to enable us to generate x,y coordinate pairs easily, and to verify that those numbers get properly plotted in the lcd at the corresponding location. The way we’ll plot a point is to use the paintoval message to lcd to draw a circular dot (of the specified radius) in the correct location. We map the x,y pair (in the range -1 to 1) to its corresponding location in the lcd, with the point 0,0 represented by pixel location 100,100 from the top left corner of the lcd. (All pixel coordinates in lcd are relative to the object’s top left corner.) The paintoval message requires that its oval’s bounding rectangle be described by four points, so once we have calculated the correct point in the graph, we subtract and add the radius from that to determine the bounding rectangle’s corners.
The drawing messages do the following. The message box on the right says, in effect, “erase the contents, set the foreground color to light gray, draw the x axis, draw the y axis, draw the center point, change the foreground color to black.” Then the bounding rectangle’s pixel coordinates are sent to the paintoval message box to form the message that will paint the black dot.