Plot an exponential curve
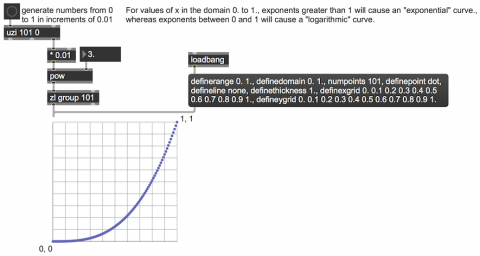
This patch allows you to see the effect of different exponents in a formula that maps input values to output values with a power function. Input values between 0 and 1, taken to some power, will always yield output values from 0 to 1, provided that the exponent is greater than or equal to 0. (When the exponent is 0, the output values will all be 1. When the exponent is less than 0, the output values will be in the range from 1 to infinity.) So, for exponential mapping of some range of input values to a corresponding range of output values, you can normalize the input values to the range 0 to 1, then take that to some power, then map the 0-to-1 results into the desired output range with a multiplication (scaling the size of the range) and an addition (to offset the range up or down). Note that exponents greater than 1 cause an exponential increase, whereas exponents between 0 and 1 cause a logarithmic increase.